
If you spend any time running local AI models with Ollama, doing ML training, or just curious about
what your GPU is actually doing, you should have nvtop installed.
It’s the GPU equivalent of htop or btop. You get a real-time view of your GPU utilization,
memory usage, temperature, and per-process breakdown, all in the terminal.
What it looks like
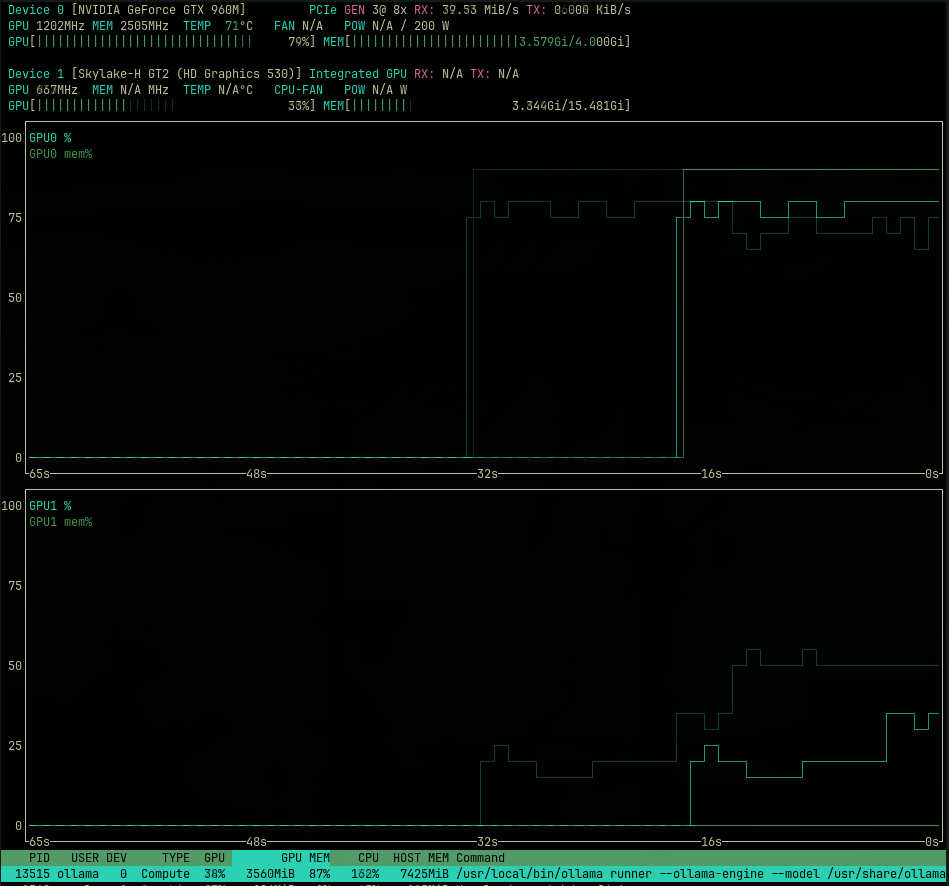
Here’s a screenshot I took while running a question through Ollama using the gemma4:e4b model
locally. You can see both GPUs being used, memory consumption climbing, and the inference process
doing its thing.
Pretty satisfying to watch, honestly.
Installing nvtop
ArchLinux (Omarchy)
sudo pacman -S nvtop
That’s it. Arch has it in the official repos.
Ubuntu
sudo apt install nvtop
Available in Ubuntu 22.04 and later. If you’re on an older release, you can build from source from the nvtop GitHub repo.
macOS
brew install nvtop
Works on macOS with supported GPUs. Note that Apple Silicon GPU support is limited compared to NVIDIA on Linux, but it still gives you useful info.
Running it
Just type:
nvtop
You’ll get an interactive TUI with graphs updating in real time. Use q to quit, and F2 to
configure what’s displayed.
If you have multiple GPUs (or an integrated + discrete setup), nvtop shows all of them. That’s one
of the things I like about it over just checking nvidia-smi, which works but feels like reading
a log file compared to this.
Why bother?
Honestly, before nvtop I was just guessing whether my GPU was being used during Ollama inference.
nvidia-smi works but you have to keep running it manually. nvtop just runs and you can tell
at a glance if the model is loading into VRAM, if it’s maxing out memory, or if it’s barely doing
anything (which usually means the model fell back to CPU).
Useful tool. Zero configuration. Worth having in your toolkit.
Rodolfo